Paid Media & Digital Marketing Stats
The digital marketing landscape is rapidly evolving, with significant growth in paid media and digital advertising. Here are some key statistics and insights:
Global Market Growth
-
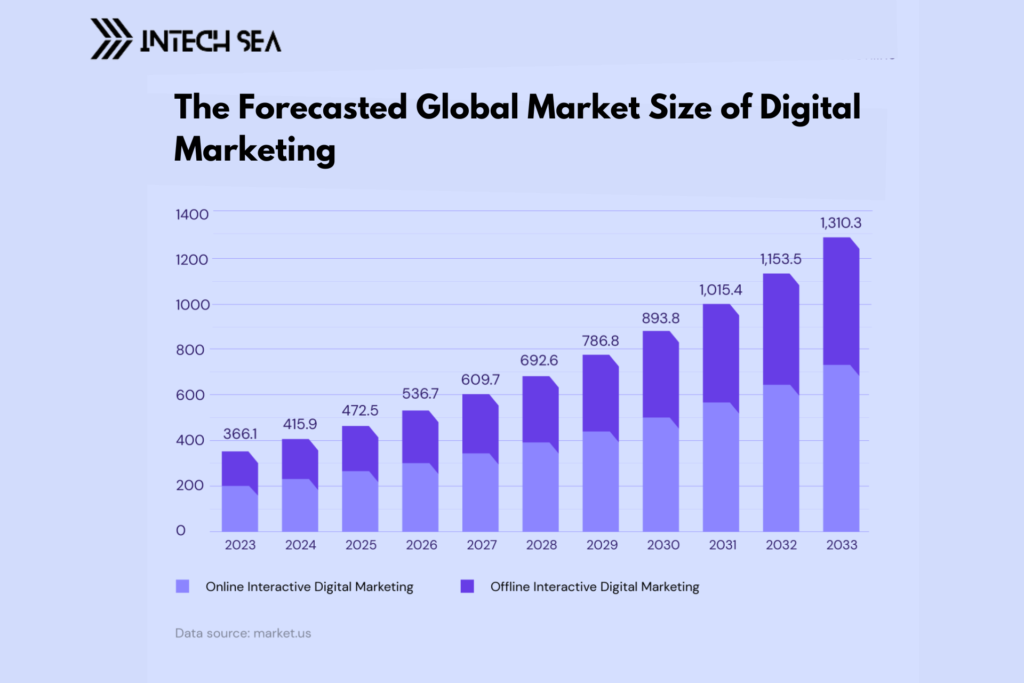
Market Size: The global digital marketing market is projected to reach approximately $1,310.3 billion by 2033, growing at a compound annual growth rate (CAGR) of 13.6% from 2024 to 2033.
-
Digital Advertising Spend: In 2023, global digital advertising spending was expected to reach $526 billion, with projections indicating continued growth in the coming years.
Advertising Channels
-
Search Advertising: Search advertising remains the largest segment, projected at $202.40 billion in 2023.
-
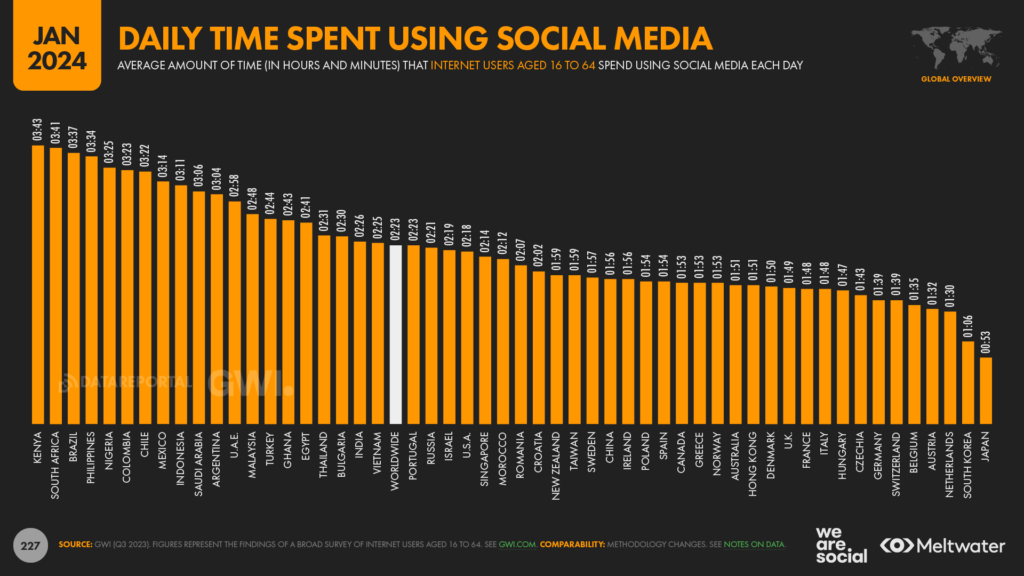
Social Media Advertising: Social media ads account for approximately 33% of all digital ad spending, with annual expenditures expected to surpass $220 billion by the end of 2024.
-
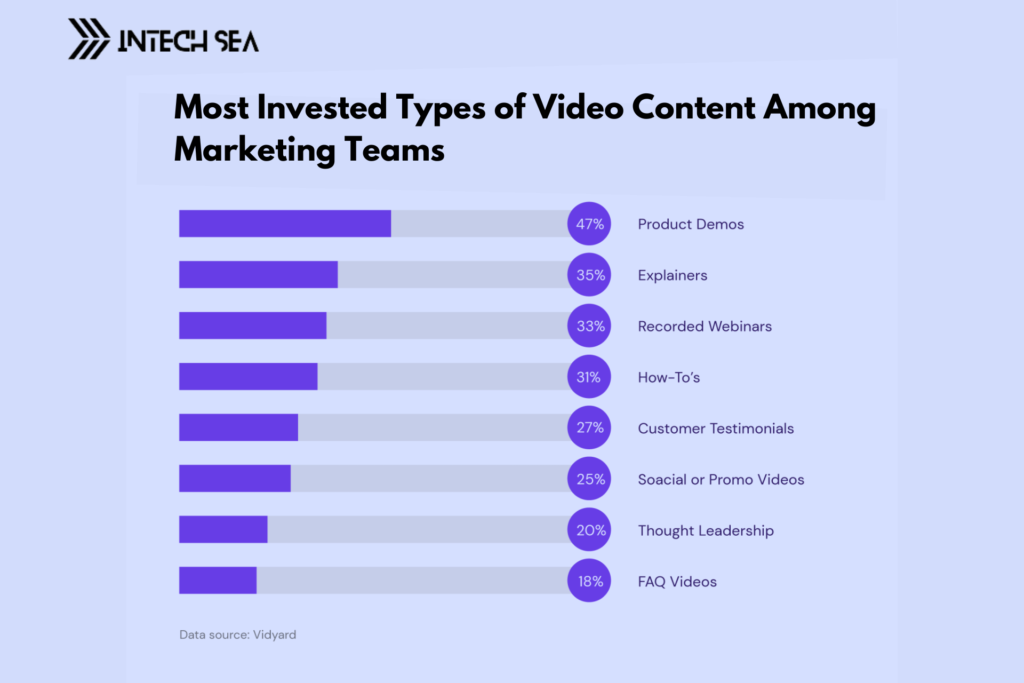
Video Advertising: Video advertising has experienced significant growth, with connected TV accounting for 55% of video inventory expenditure.
Return on Investment (ROI)
-
Pay-Per-Click (PPC): PPC campaigns yield an average ROI of 200%, with platforms like Google Ads and Facebook Ads delivering the highest returns.
-
Email Marketing: Email marketing offers a substantial ROI, returning $36 to $40 for every $1 spent.
Consumer Behavior and Trends
-
Mobile Usage: As of January 2024, 59.01% of web traffic searches occur on mobile devices, highlighting the importance of mobile optimization in digital marketing strategies.
-
Content Consumption: Over 50% of content interactions result from organic search, emphasizing the need for effective search engine optimization (SEO) practices.
Industry Outlook
- Advertising Industry Revenue: The global advertising industry is projected to surpass $1 trillion in revenue for the first time in 2024, with digital platforms accounting for a significant portion of this growth.
These statistics underscore the dynamic nature of paid media and digital marketing, highlighting the importance of adapting strategies to leverage emerging trends and technologies.
Types of Research Studies and Statistics Used in Paid Media
Various research methods and statistics are employed in paid media to derive insights, measure performance, and optimize an advertising campaign. Market research studies instruct businesses on their target audience, competitors, and market trends, thereby allowing them to determine their advertising strategy. Research about consumer reactions to advertisements, factors influencing buying decisions, and strategies to effectively reach them is very important. Such research empowers companies to come up with highly focused and effective advertising strategies governing their target market.
Statistical aspects are followed throughout with most successful businesses tracking key metrics and parameters to monitor performance in regard to advertising campaigns. Metrics such as click-through rates, conversion rates, cost per acquisition, and return on ad spend remain the determining factors in measuring the effectiveness of any paid media efforts. Once businesses start analyzing these various statistics, they can figure out what is working or where they need to improve on, thereby giving them room in campaigns for improvement. Statistical tools and analysis techniques help businesses in making data-centric decisions, fiscal spending allocations, and organizations in their resource allocations are based more on where the impact is maximized.
While apart from traditional research studies and statistics, these businesses also further leverage advanced data analytics to obtain a better understanding of consumer behavior and campaign performance. Predictive analytics, machine learning, and artificial intelligence algorithms assist a business in making predictions about trends, personalize advertisements, and real-time optimize targeting strategies for campaigns. These advanced methodologies give companies success through staying ahead of their competitors while adapting to fluctuations in their markets, thereby ensuring better outcomes for data-driven advertising.
Difference Between Paid Media and Digital Marketing in the Chart
Here’s a comparison chart that highlights the key differences between paid media and digital marketing:
| Category | Paid Media | Digital Marketing |
|---|---|---|
| Channels | Search ads, Social media ads, Display ads, Video ads, Influencer marketing, Affiliate marketing | SEO, Content marketing, Social media marketing, Email marketing, PPC, Affiliate marketing |
| Objective | Immediate traffic and conversions, Brand awareness | Long-term engagement, Brand loyalty, Lead generation |
| Payment Model | Pay-per-click (PPC), Pay-per-impression, Fixed costs for influencer and affiliate deals | Mix of paid and organic efforts |
| ROI Measurement | Direct metrics (clicks, impressions, conversions), Immediate | Combination of direct and indirect metrics (engagement, lead quality), Long-term |
| Examples | Google Ads, Facebook Ads, Sponsored posts on Instagram, YouTube video ads | Blog posts, SEO optimizations, Organic social media posts, Email newsletters |
This chart contrasts the specific attributes of paid media and digital marketing, showcasing how each approach fits within a broader marketing strategy.
Types of Paid Media with Market Size and Stats for 2024
- Search Engine Advertising (Pay-Per-Click, PPC)
- Market Size: The global market for PPC advertising, primarily driven by platforms like Google Ads and Bing Ads, is expected to grow significantly. The overall digital advertising market is projected to reach $1.5 trillion by 2030, with PPC being a substantial component of this growth (Research & Markets).
- Stats: The Internet paid search segment captured a significant market share in 2023, driven by its highly targeted approach and data-driven insights (Market.us).
- Market Size: The global market for PPC advertising, primarily driven by platforms like Google Ads and Bing Ads, is expected to grow significantly. The overall digital advertising market is projected to reach $1.5 trillion by 2030, with PPC being a substantial component of this growth (Research & Markets).
- Social Media Advertising
- Market Size: Social media advertising spending is projected to reach $263 billion by 2028 (The Goat Agency).
- Stats: Instagram is noted for providing the highest ROI for 25% of marketers, with social media ad campaigns averaging a 250% ROI (The Goat Agency).
- Market Size: Social media advertising spending is projected to reach $263 billion by 2028 (The Goat Agency).
- Display Advertising
- Market Size: Display advertising is set to reach $939.4 billion by 2030, growing at a CAGR of 13.2% (Research & Markets).
- Stats: Display ads include banner ads, rich media, and more, and are critical for brand visibility across websites and apps.
- Market Size: Display advertising is set to reach $939.4 billion by 2030, growing at a CAGR of 13.2% (Research & Markets).
- Video Advertising
- Market Size: Video advertising, particularly on platforms like YouTube, is a major segment within digital advertising. While specific figures for 2024 are not always separated, video is a substantial part of the overall digital ad spend.
- Stats: Short-form videos are leading the ROI charts, with 67% of social media marketers planning to invest more in this format (HubSpot Blog) (AdMedia Blog).
- Market Size: Video advertising, particularly on platforms like YouTube, is a major segment within digital advertising. While specific figures for 2024 are not always separated, video is a substantial part of the overall digital ad spend.
- Native Advertising
- Market Size: Native advertising is expected to be a $400 billion industry by 2025, growing due to its non-intrusive nature and high engagement rates.
- Stats: Native ads are designed to blend in with the content of the platform on which they appear, leading to better user engagement compared to traditional ads.
- Market Size: Native advertising is expected to be a $400 billion industry by 2025, growing due to its non-intrusive nature and high engagement rates.
- Programmatic Advertising
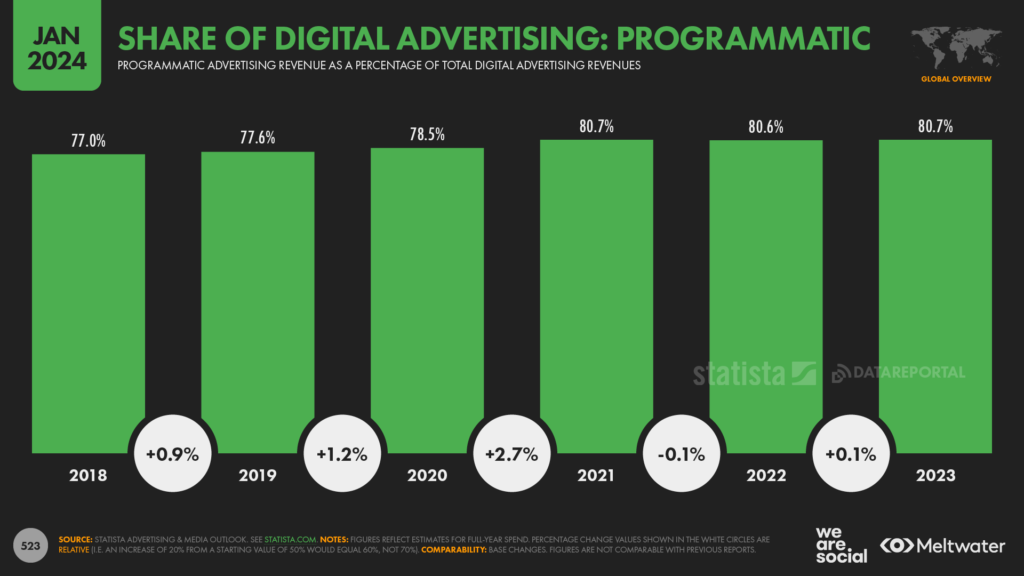
- Market Size: Programmatic advertising is projected to reach $155 billion by 2024. It automates the buying and selling of ad space, making the process more efficient.
- Stats: This method leverages AI and real-time bidding to optimize ad placements and target audiences precisely.
- Market Size: Programmatic advertising is projected to reach $155 billion by 2024. It automates the buying and selling of ad space, making the process more efficient.
- Influencer Marketing
- Market Size: The influencer marketing industry is expected to grow to approximately $22.2 billion by 2024.
- Stats: Influencer marketing involves paying individuals with significant social media followings to promote products or services, leveraging their influence to reach target audiences effectively.
- Market Size: The influencer marketing industry is expected to grow to approximately $22.2 billion by 2024.
- Affiliate Marketing
- Market Size: Affiliate marketing is predicted to grow to $8.2 billion by 2024 in the US alone.
- Stats: This performance-based marketing pays affiliates a commission for driving traffic or sales to a business’s website.
- Market Size: Affiliate marketing is predicted to grow to $8.2 billion by 2024 in the US alone.
- Email Marketing
- Market Size: Global spending on email marketing is expected to reach $17.9 billion by 2027.
- Stats: Email marketing campaigns can see high returns, especially when personalized and segmented, with open rates increasing by 26% and click-through rates by 100.95% for segmented campaigns (AdMedia Blog).
- Market Size: Global spending on email marketing is expected to reach $17.9 billion by 2027.
- Audio Advertising
- Market Size: Digital audio advertising, including podcast ads and streaming services like Spotify, is projected to reach $8.04 billion by 2025.
- Stats: Audio advertising is becoming increasingly popular due to the growing number of podcast listeners and music streamers.
- Market Size: Digital audio advertising, including podcast ads and streaming services like Spotify, is projected to reach $8.04 billion by 2025.
These types of paid media represent the most diverse and the fastest-growing segment within the digital advertising landscape, providing substantial growth to anticipated global market size while offering plenty of opportunities for implementing cost-effective targeted marketing strategies.
Global Digital Marketing Market Size 2024
As of June 2024, the global digital marketing market size will continue to grow, driven by the increasing penetration of the internet, by businesses’ digital transformation efforts, and by the rise in the use of digital channels for marketing purposes. Exact figures may vary depending on the source and methodology, but several industry reports and forecasts had pointed to the anticipated size of this market:
- Statista: According to Statista, the global digital advertising market size is expected to reach approximately $586 billion in 2024, reflecting the overall spending on digital marketing activities including advertising, content marketing, social media marketing, and more.
- IDC: IDC forecasts that spending on digital advertising and marketing technology will continue to grow, driven by advancements in data analytics, AI-driven marketing solutions, and the need for personalized customer experiences.
- Forrester: Forrester’s research indicates a significant shift towards digital marketing strategies, with investments in digital channels such as social media, search engine optimization (SEO), and mobile marketing driving overall market growth.
These projections reveal the continued growth of the digital marketing sector, with close to 76% of marketers predicting an increasing priority by businesses on online engagement and digital strategies to access international brands and to communicate with consumers. One thing is for certain: to gain precise figures and more detailed insights on certain industries, the best practice is to refer to the latest reports from these research firms or specific industry publications.
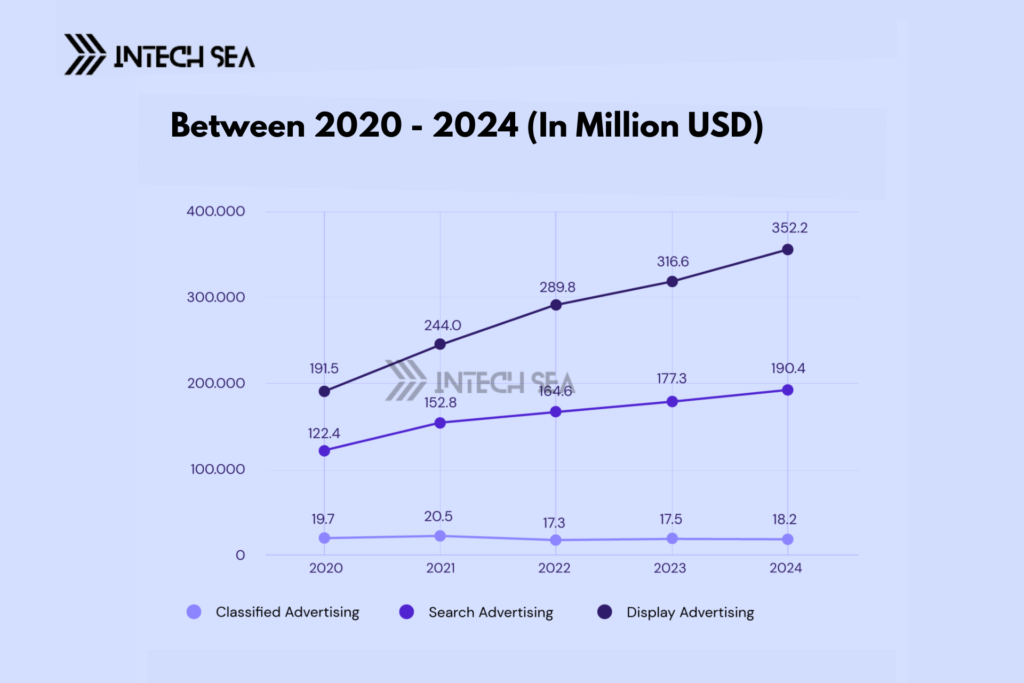
Social media advertising statistics
- Global Ad Spending: Social media advertising spending globally has reached $227.2 billion in 2024. In the United States alone, it’s projected to hit $85.31 billion by the end of the year (Social Media Dashboard) (DemandSage).
- Platform Usage:
- Facebook: With nearly 3 billion users, Facebook remains the most-used social media platform globally. Users spend an average of 19 hours and 43 minutes per month on the platform (DemandSage).
- Instagram: Instagram boasts 2 billion monthly active users. Reels account for 30% of the time spent on the app, reflecting its growing engagement (Social Media Dashboard) (The Goat Agency).
- TikTok: Expected to reach over 2 billion users in 2024, TikTok users spend about 23 hours and 28 minutes per month on the app, making it the platform where users spend the most time monthly (Sprout Social) (DemandSage).
- Facebook: With nearly 3 billion users, Facebook remains the most-used social media platform globally. Users spend an average of 19 hours and 43 minutes per month on the platform (DemandSage).
- Demographics:
- TikTok: Around 70.2% of TikTok users are under the age of 34. It is especially popular among younger audiences, with 36.7% of its users aged 18-24 (Social Media Dashboard) (The Goat Agency).
- LinkedIn: LinkedIn has over 1 billion members globally, with a strong presence in the United States, where it reaches over 214 million users (Sprout Social).
- TikTok: Around 70.2% of TikTok users are under the age of 34. It is especially popular among younger audiences, with 36.7% of its users aged 18-24 (Social Media Dashboard) (The Goat Agency).
- Engagement and ROI:
- Instagram: Provides the highest ROI for 25% of marketers, with engagement rates four times higher than Facebook (Sprout Social) (The Goat Agency).
- TikTok: Known for its high engagement, with users spending an average of 1.5 hours daily on the platform (The Goat Agency).
- Instagram: Provides the highest ROI for 25% of marketers, with engagement rates four times higher than Facebook (Sprout Social) (The Goat Agency).
- Social Commerce:
- Purchasing Behavior: 50% of TikTok users have bought something after watching a Live, demonstrating the platform’s strong influence on purchasing decisions (The Goat Agency).
- Brand Discovery: 48% of consumers aged 18-54 discover new products on social media, highlighting the importance of these platforms for brand visibility (The Goat Agency).
- Purchasing Behavior: 50% of TikTok users have bought something after watching a Live, demonstrating the platform’s strong influence on purchasing decisions (The Goat Agency).
- Advertising Reach:
- Facebook Ads: Reach over 2.14 billion users, making it a powerful platform for marketers (Social Media Dashboard).
- Instagram Ads: Reach around 1.48 billion users, showing significant advertising potential (The Goat Agency).
- Facebook Ads: Reach over 2.14 billion users, making it a powerful platform for marketers (Social Media Dashboard).
It all seems to point toward the fact that advertising of the money from the social media is getting more and more attention and resources, around the platforms where their engagements with clients have shown serious positive return on investment are TikTok and Instagram. Insights contained in such statistics would help businesses align their social media marketing strategies.
Conversely, social media ad spend is quietly progressing in a predictable manner. With ad spending on the rise, brands should anticipate carving larger chunks of the budget out for paid marketing if they are to stay competitive.
2024 Analysis of Social Media Advertising Market Size and Value
1. Current Trends and Growth Patterns:
- The social media advertising market has been growing at a robust pace. As of 2023, the market size was estimated to be around $200 billion USD.
- The market has been experiencing an average annual growth rate of approximately 12%. This growth is driven by increasing digital engagement, advancements in targeting technology, and higher ROI for businesses.
2. Projected Market Size for 2024:
- Based on the current growth rate, the social media advertising market size is projected to reach $224 billion USD by 2024. This projection is calculated using the formula for compound annual growth:
Projected Market Size 2024=Current Market Size 2023×(1+Annual Growth Rate)\text{Projected Market Size 2024} = \text{Current Market Size 2023} \times (1 + \text{Annual Growth Rate})Projected Market Size 2024=Current Market Size 2023×(1+Annual Growth Rate) Substituting the values: 224 billion USD=200 billion USD×(1+0.12)224 \, \text{billion USD} = 200 \, \text{billion USD} \times (1 + 0.12)224billion USD=200billion USD×(1+0.12)
3. Factors Driving the Market:
- Increased Mobile Usage: With more users accessing social media through mobile devices, mobile advertising has become a significant segment within the overall market.
- Enhanced Targeting Capabilities: Social media platforms are continually improving their algorithms and data analytics capabilities, allowing advertisers to target audiences more effectively.
- Video Content Popularity: The surge in video content consumption has led platforms to offer more video ad formats, which tend to have higher engagement rates.
- E-commerce Integration: The integration of e-commerce functionalities within social media platforms has turned them into major sales channels, encouraging businesses to invest more in social media ads.
- Adoption of AI and Automation: Artificial Intelligence (AI) and machine learning are being increasingly utilized to optimize ad delivery and improve the overall efficiency of advertising campaigns.
4. Market Segmentation:
- By Platform: Major platforms include Facebook, Instagram, Twitter, LinkedIn, TikTok, and Snapchat. Each platform offers unique advertising solutions tailored to different audience demographics and business goals.
- By Format: Advertisements can be in the form of display ads, video ads, sponsored posts, stories, and influencer marketing.
- By Industry: Various industries such as retail, automotive, healthcare, entertainment, and finance are leveraging social media advertising to reach their target audiences.
5. Regional Insights:
- The North American region, particularly the United States, remains the largest market for social media advertising due to high social media penetration and advanced digital infrastructure.
- The Asia-Pacific region is witnessing rapid growth, driven by increasing internet penetration and mobile device usage, especially in countries like China and India.
- Europe also shows strong growth potential, with businesses increasingly adopting digital advertising strategies.
6. Challenges and Considerations:
- Privacy Concerns: Increasing concerns about data privacy and regulatory changes, such as the GDPR in Europe, could impact targeting capabilities and ad effectiveness.
- Ad Blockers: The use of ad blockers is on the rise, which can reduce the visibility and impact of social media advertisements.
- Market Saturation: As more businesses invest in social media advertising, competition for ad space and consumer attention is intensifying, potentially driving up costs.
The social media advertising market is poised for continued growth in 2024, with an estimated market size of $224 billion USD. The ongoing advancements in technology, coupled with the evolving digital habits of consumers, will continue to drive this growth. However, businesses need to be mindful of the challenges such as privacy concerns and market saturation while planning their social media advertising strategies
Benefits of Using Research and Stats in Paid Media Campaigns
The benefits of using research studies and statistics within paid media campaigns vary from improved targeting and performance optimization to a higher return on investment and competitive edge. Research studies tell the business who its ideal customers are, their needs and preferences, and how they can communicate with their audience through targeted ad campaigns. Data analysis uses allowed evaluations to identify success and monitored key indicators while making information-driven choices for maximizing performance.
Reading appropriate metrics such as click-through rates, conversion rates, and return on investments, ROI, gives business peculiar perspectives on how their ad campaigns perform and makes them able to take data-driven decisions for proper optimization, ultimately leading such businesses toward better ROI from their paid media.
Statistical studies provide flexibility and allow businesses to gauge market trends and changes in the buyers’ behavior. Continuously monitoring the analyzed data allows them to readjust their ads in real-time, fitting properly their audience’s needs and instilling decisions for boosting sales. This flexibility and agility offers businesses a competitive edge in a world that is fast-paced and digital; by engaging in the data-driven advertising, they can drive results that are therefore meaningful while creating value and staying ahead of the pack.
How to Conduct Effective Research for Data-Driven Advertising
Conducting actionable research studies is essential for businesses willing to successfully leverage data-driven advertising. The first step of conducting research studies to achieve certain goals- for instance, learning more about the target audience, identifying trends in the market, or gauging the effectiveness of advertising campaigns- will assist firms to focus their research efforts toward gathering relevant data meaningful to their advertising strategy.
Once the appropriate objectives have been defined, businesses can use various research methods and techniques to promote effective data collection. In general, the common methods in data-driven advertising for collecting consumer insights and analyzing market trends include surveys, focus groups, interviews, and observational studies. By rationally choosing their research methods, businesses gather pertinent data that would inform their advertising strategies and create opportunities for data-driven decisions.
After gathering the data, the overriding task now would be for the businesses to analyze and interpret the findings toward deriving actionable insights that could be used in building their advertising plans. Employing statistical analysis techniques, data visualization tools, and reporting mechanisms help in streamlining businesses’ comprehension of the collected data and allowing them to acquire helpful conclusions. Ultimately, trend and pattern analysis together with correlation statistics assist businesses in enhancing their advertising strategies, generate better results using data-driven advertising.
Important Metrics in Data-Driven Advertising
Key performance metrics and measures in data-driven advertising assist organizations in evaluating the performance of their campaigns, determining the effects of their ads, and making data-informed decisions for improvements. Some of the key performance metrics used to gauge the efficiency of paid media efforts include click-through rate (CTR), conversion rate, customer acquisition cost (CPA), return on ad spend (ROAS), and customer lifetime value (CLV). Businesses can, therefore, judge the performance of their ads, identify areas that require improvements, and enhance advertising strategies for desirable outcomes.
CTF is the number of clicks an ad gets when it is viewed, indicating how interesting or uninteresting the advertisement is to its intended audience. The conversion rate is the ratio of clicks on a given ad that resulted in a specific action, such as making a purchase or signing up for a newsletter. The CPA indicates the costs associated with customer acquisition through the advertising, thus allowing businesses to compare efficiencies of different campaigns. ROAS says how much revenue is brought in for each dollar spent on advertising; it therefore enables a business to understand the profitability of its paid media. CLV is the combined profit realized from that one customer, which a business should expect over the entire relationship with that customer; it thus brings in consideration of the future in the evaluation of an advertising campaign.
Through keeping track of those mentioned key metrics and measurements, businesses will understand how effective their advertising campaigns are being performed relative to their major drivers down to the details that require improvements. These metrics inform businesses of how effective their ads are, assist them in disposing of their budgets judiciously, and draw a direct line between advertisers’ advertising actions and pay-per-click profits.
Tools for Research and Statistics Analysis
The experiment is the best way of getting information, if you know the substance. These experiments range from survey platforms and data analytics tools to statistical software and reporting dashboards, which can help companies broaden their viewpoint, reveal a breadth of performance, measure, and optimize their commercial ends. Here, we will dig deep into few tools and resources available for carrying out research studies and analysis in paid media.
Survey platforms, including SurveyMonkey, Google Forms, and Typeform, allow companies to create and disseminate the survey to get feedback from consumers and insights into consumer behavior. They offer customizable survey templates, data visualizing tools, and reporting features helping businesses provide effective analyzes and interpretations of survey data. With the help of various features provided by these platforms, businesses gain insights that support their advertising strategies and create better results in data-driven advertising.
Data analytics tools such as Google Analytics, Adobe Analytics, and Mixpanel allow companies to track and measure the performance of their advertising campaigns. Each company uses these tools for website traffic analysis and real-time monitoring of key metrics. These analytics tools provide companies with insights about users’ behavior, the pattern of engagement, and the conversions they are making, which will help companies optimize their advertisements based on such data grievances. Similarly, equipped with these insights, companies can make wise decisions, allocate resources efficiently, and improve their ad performance.
Statistical software such as SPSS, R, and SAS enable a business to perform data analysis and interpretation of the collected data, carrying out statistical tests to find patterns and trends within the advertising campaigns of that given business unit. The software offers advanced statistical analyses backed by information visualization functions and reporting capabilities that assist in making sense of gathered data and drawing insightful conclusions. Hence, using any kind of statistical software could help the companies to optimize their advertising strategies, measure performances, and drive better results for data-driven advertising.
Challenges in Using Research and Stats for Paid Media
Research studies and statistics have important benefits for and will assist impacted businesses in running successful paid media campaigns. Yet these resources may present additional challenges and considerations that hinder businesses from making full use of them. Among the chief challenges is the length and complexity of data collection and analysis, requiring businesses to have the right expertise, resources, and tools to gather and analyze data correctly. Without that ability to keep the data at hand and correctly interpret it, businesses may end up with research studies and statistics that offer scant real-world insight.
Continuously optimizing and adapting advertising strategies to evolving market dynamics and consumer behavior is something businesses are faced with. Research studies and statistics provide insight, and business must be quicker, making their decisions and strategies change as consumer behaviors shift, ed and altered under market pressure and competitor action. This urge to continuously adapt and refine SPF has compelled companies to develop a data-driven culture in their organizations and make a living structure different tests and techniques.
Lastly, companies must consider privacy and security regulations when doing speculative studies and analyzing statistics in paid media campaigns. More than ever, with growing attention toward data privacy and security in the eye of the world, businesses must adhere to regulations such as GDPR and CCPA. By doing so, they can ensure data safety and earn the audience’s trust. In so doing, businesses may earn credibility, trust, and reputation by establishing responsible data-driven advertisement practices.
Using Research and Stats for Successful Data-Driven Ads
The research study and the statistics are the basic granaries of unlocking the real power of data-influenced advertising for a business, whether through audience targeting, optimization of advertising strategies, or the generating of winning results. In this case, consumers’ behaviors are researched and statistics refined, through which, said to operate their modicum-aided decision-making-that enhanced their advertising efforts. Effective research studies should enable the establishment of trends, insight into viewers, and the design of a focused advertising campaign presentation whose resonance will be felt by the customers. Some of the key measurements and metrics are provided with the salient statistics, in providing them with the basis of assessing and tracing the efficiency of ads, how a campaign has performed, and a corresponding tweak of strategy for the most effectiveness.
Case studies demonstrate the way research studies and statistics enabled maximization of the advertising strategy, the audience being targeted, and the layout for continued performance improvements and ROI. Such key metrics and measures will inform the business in understanding the performance measure of their ads, how effective the campaigns have been, and how these will, in a manner supported by data, adjust advertising efforts in the course of development.
As businesses continue their venture in increasing the surface area of paid media by empowering research studies and statistics, they are able to remain agile in adjusting to competition and market changes while effecting better results through data-oriented advertising. The insights will be formed when employing some of the tools and resources for the undertaking of research studies and statistical analysis; they provide measured performance and data-driven strategies within the advertising scheme. While the researchers had dealt with bumps along the way that were steering forward with research studies and statistics, businesses have to overcome such variants through a concerted emphasis on managing their data, as well as not losing pace with market optimization and privacy compliance.
Extra Information And Images
